Python
Find Moving Average Slope, Angle and its Trend using python

FabTrader
Technical analysis continues to be one of the most powerful tools in an investor's arsenal. While there are countless indicators available, sometimes the simplest approaches yield the most valuable insights. Today, I want to share a technique I've been using for years that has consistently helped me identify trend strength and potential reversals: calculating the slope of moving averages.
Why Moving Average Slopes Matter
Moving averages smooth out price data to help us see the underlying trend. But here's the thing – it's not just about whether a stock is trading above or below its moving average. The angle or slope of that moving average tells us something crucial about momentum.
A steep upward slope indicates strong bullish momentum. A flattening slope might signal a potential trend weakening. And a downward slope often confirms bearish momentum is taking hold.
After years of eyeballing these slopes on charts, I finally decided to quantify this approach. Below, I'll share the exact method I use to calculate these slopes and how you can implement it yourself.
The Python Implementation
I've created a straightforward Python script that:
- Pulls real stock data from Yahoo Finance
- Calculates a moving average (I typically use 20 days)
- Measures the slope of that moving average over a recent period (usually 30 days)
- Visualizes everything so you can see what's happening
#
"""
------------------------------------------------------------------------------------
                          FabTrader Algo Trading
------------------------------------------------------------------------------------
This utility calculates the slope of a moving average for a given scrip

For more information, visit our alog trading community:
www.fabtrader.in
"""
import numpy as np
import pandas as pd
import matplotlib.pyplot as plt
from datetime import datetime, timedelta
from sklearn.linear_model import LinearRegression
import yfinance as yf


def calculate_ma_slope(prices, ma_window=20, slope_period=30):
    """
    Calculate the slope of the moving average line for a given time period.

    Parameters:
    ----------
    prices : pandas Series
        Series of historical closing prices.
    ma_window : int
        Window size for the moving average calculation (default: 20 days).
    slope_period : int
        Time period over which to calculate the slope (default: 30 days).

    Returns:
    -------
    slope : float
        The slope of the moving average line over the specified period.
    """
    # Ensure we have enough data
    if len(prices) < ma_window + slope_period:
        raise ValueError(f"Need at least {ma_window + slope_period} data points")

    # Calculate moving average
    ma_series = prices.rolling(window=ma_window).mean()

    # Get the last slope_period points where MA is available
    ma_values = ma_series.dropna().iloc[-slope_period:].values

    # Create X values (time indices)
    X = np.array(range(slope_period)).reshape(-1, 1)

    # Fit linear regression to find the slope
    model = LinearRegression()
    model.fit(X, ma_values)

    # Get the slope coefficient
    slope = model.coef_[0]

    return slope, ma_series


def analyze_stock_ma_slope(ticker_symbol="AAPL", ma_window=20, slope_period=30, days_of_data=200):
    """
    Analyze the moving average slope for a given stock ticker.

    Parameters:
    ----------
    ticker_symbol : str
        Yahoo Finance ticker symbol (default: "AAPL" for Apple Inc).
    ma_window : int
        Window size for the moving average calculation (default: 20 days).
    slope_period : int
        Time period over which to calculate the slope (default: 30 days).
    days_of_data : int
        Number of days of historical data to retrieve (default: 200).
    """
    # Download data
    end_date = datetime.now()
    start_date = end_date - timedelta(days=days_of_data + 50)  # Add buffer for weekends/holidays

    # print(
    #     f"Downloading data for {ticker_symbol} from {start_date.strftime('%Y-%m-%d')} to {end_date.strftime('%Y-%m-%d')}...")

    data = yf.download(ticker_symbol, start=start_date, end=end_date, progress=False, auto_adjust=True)

    if data.empty:
        print(f"No data found for ticker {ticker_symbol}")
        return

    # print(f"Retrieved {len(data)} days of data for {ticker_symbol}")

    # Ensure we have enough data
    if len(data) < ma_window + slope_period:
        print(f"Not enough data. Need at least {ma_window + slope_period} trading days.")
        return

    # Calculate MA and its slope
    closing_prices = data['Close']
    slope, ma_series = calculate_ma_slope(closing_prices, ma_window, slope_period)

    print(f"\nStock : {ticker_symbol}")
    print(f"{ma_window}-Day MA slope over the last {slope_period} days: {slope[0]:.4f}")

    # Determine trend strength and direction
    abs_slope = abs(slope)
    if abs_slope < 0.1:
        strength = "very weak"
    elif abs_slope < 0.5:
        strength = "weak"
    elif abs_slope < 1.0:
        strength = "moderate"
    elif abs_slope < 2.0:
        strength = "strong"
    else:
        strength = "very strong"

    direction = "upward" if slope > 0 else "downward"
    if abs_slope < 0.05:
        trend_description = "mostly flat"
    else:
        trend_description = f"{strength} {direction}"

    print(f"Moving Average Slope Trend: {trend_description}")


if __name__ == "__main__":
    # You can change these parameters
    ticker = "AAPL"  # Apple Inc.
    ma_window = 20  # 20-day moving average
    slope_period = 30  # Calculate slope over 30 days

    analyze_stock_ma_slope(ticker_symbol=ticker, ma_window=ma_window, slope_period=slope_period)
How It Works
The magic happens in the calculate_ma_slope() function. Here's what it does:
- First, we calculate the moving average of our price data (typically the 20-day MA)
- Then we take the most recent period (typically 30 days) of that moving average
- Next, we use linear regression to fit a straight line to those MA points
- Finally, we extract the slope coefficient from that regression line
This approach gives us a precise, quantitative measure of the MA slope rather than just eyeballing it.
Real-World Example: Apple (AAPL)
Let me show you a recent analysis I did on Apple stock. Running the code with default parameters gave me the following output:
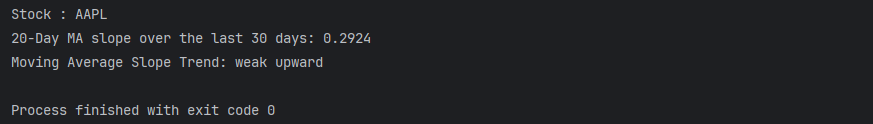
Interpreting Slope Values
Over time, I've developed some guidelines for interpreting these slope values:
- Very Strong Uptrend: Slope > 2.0
- Strong Uptrend: Slope between 1.0 and 2.0
- Moderate Uptrend: Slope between 0.5 and 1.0
- Mild Uptrend: Slope between 0.1 and 0.5
- Flat/Sideways: Slope between -0.1 and 0.1
- Mild Downtrend: Slope between -0.5 and -0.1
- Moderate Downtrend: Slope between -1.0 and -0.5
- Strong Downtrend: Slope between -2.0 and -1.0
- Very Strong Downtrend: Slope < -2.0
These values will vary somewhat depending on the price of the stock – a $1000 stock will naturally have larger slope values than a $10 stock. But the classifications still provide a good rule of thumb.
How I Use This in My Trading
I use this tool as part of my broader analysis process. Here's my typical approach:
- Run this analysis on my watchlist stocks weekly
- Flag stocks with significant slope changes (e.g., from negative to positive)
- Look for stocks where the slope is strengthening but price hasn't yet made a big move
- Be cautious with stocks showing extremely steep slopes – they often revert
The most valuable signals often come from slope changes rather than absolute values. A slope that's turning from negative to positive can indicate a new uptrend forming, even before it becomes obvious on the chart.
Conclusion
Moving average slopes provide a quantifiable measure of trend strength that's often overlooked by casual chart readers. By incorporating this analysis into your toolkit, you gain deeper insight into momentum and potential trend changes.
In future posts, I'll explore how to combine this slope analysis with other indicators like RSI and MACD to create a more comprehensive trading system. I'll also share some specific case studies where this approach identified significant market turns well ahead of more common indicators.
More from Python
Finding the Most Liquid Equity ETFs in each Category using Python
Not all ETFs are created equal — especially when it comes to liquidity. While NSE provides a full ETF list, identifying the...
The Market’s Coiled Spring — Building the Momentum Squeeze Indicator in Python
Volatility doesn’t expand randomly — it contracts first. The Momentum Squeeze Indicator, popularized by LazyBear, is built on this simple but powerful...
Price Consolidation Boxes: Ranges, Breakouts, and Retests Using Python
Markets don’t trend most of the time — they pause, compress, and consolidate. Before every meaningful move up or down, price typically...