Investing
Nifty all Set for a 25%+ rally - Quiet Signal from indicator

FabTrader
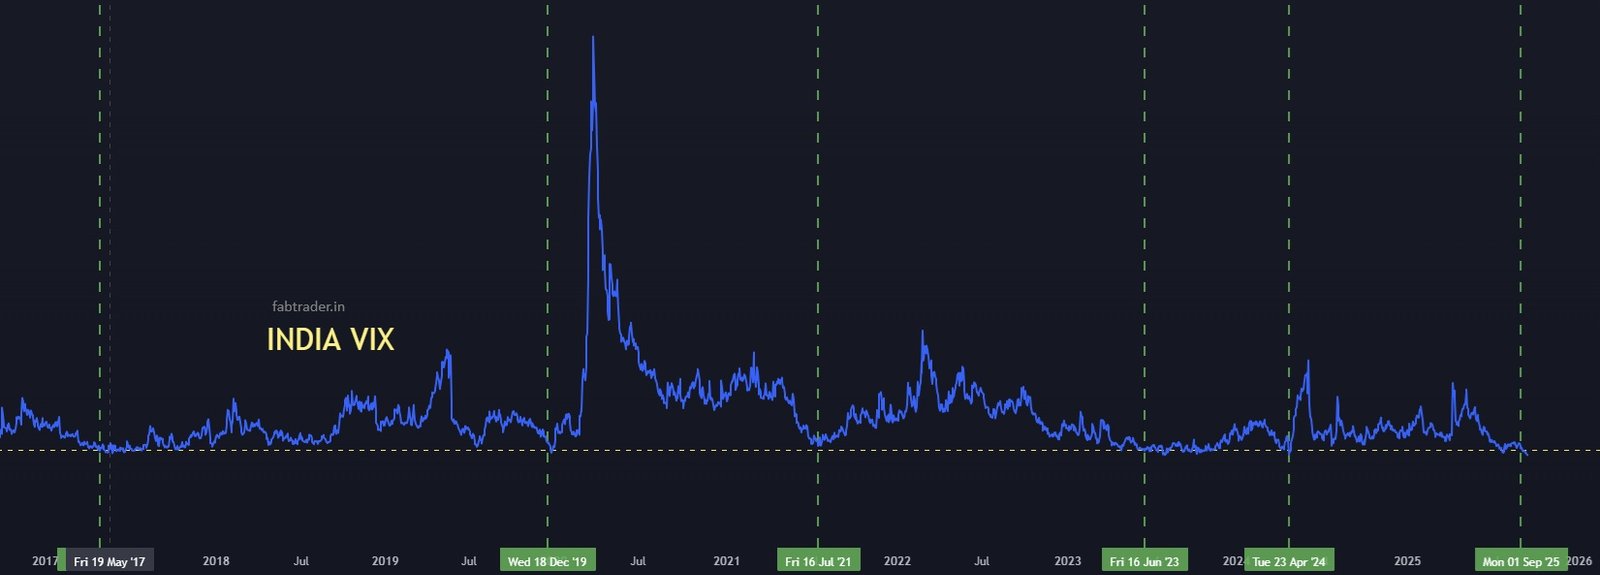
When the stock market seems calm, it’s often the perfect time to pay attention. On September 3, 2025, India’s VIX—the index that tracks market volatility expectations—slipped below 11, a level rarely seen. At first glance, it might seem like just another data point. But if history is any guide, this quiet moment could be the market’s way of signaling something big is around the corner.
What Is India VIX and Why Should You Care?
For those who don’t follow the markets every day, India VIX can seem like technical jargon. Simply put, India VIX measures the expected volatility in the Nifty 50 index over the next 30 days, based on option prices. A higher VIX means traders expect big swings (usually down), while a lower VIX suggests confidence and calm in the market.
Typically, VIX values below 13 are considered unusually low. But a reading under 11? That’s exceedingly rare, signaling a level of market calmness we don’t see often.
History Doesn’t Lie: The VIX–Nifty Connection
Here’s where things get interesting.
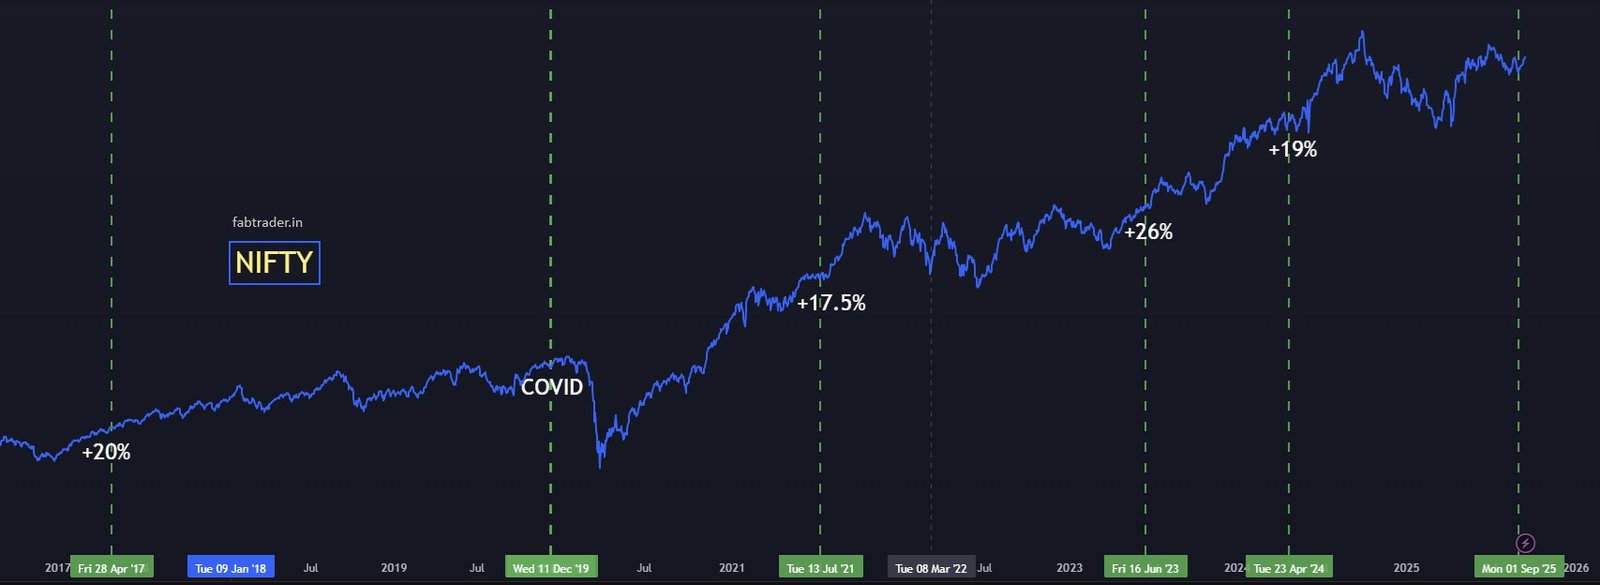
In the past decade, India VIX has dipped below 11 during five major time windows. Out of these five instances, four were followed by significant Nifty rallies—20% or more—within the next 6 to 12 months. That’s a pretty consistent pattern.
For example:
- In mid-2023, VIX hovered around 10.1. In the subsequent year, Nifty surged by over 25%.
- Similar rallies occurred after low VIX readings in 2017 and 2024, each rewarding investors who stayed patient.
There was just one major exception: December 2019. Right before the COVID-19 pandemic reshaped the world, India VIX briefly dipped below 11. What followed was an unpredictable global crisis, making this period an outlier in the otherwise consistent trend.
So, why does this happen? The answer lies in human nature and market cycles. Periods of extreme calm often reflect complacency. Investors aren’t bracing for major moves because they don’t expect any. Historically, such complacency tends to be a precursor to significant market shifts—usually upward in normal conditions, but not guaranteed.
What Should Retail Investors Do Now?
First, don’t view this as a silver bullet or a guarantee. No indicator can predict the future with certainty. Instead, think of the India VIX dipping below 11 as a gentle but significant nudge—a historical signpost that suggests market momentum may shift soon.
For long-term investors, it’s a good time to review portfolios, ensure asset allocation makes sense, and perhaps prepare for more volatility ahead. Those actively trading may want to watch for early signs of a market reversal, as history suggests that low VIX levels have often been followed by strong rallies.
The Bigger Picture: Patience and Preparation Win
Markets rarely stay this calm forever. The sub-11 India VIX is not a headline screaming “Buy Now!” Instead, it’s a quiet signal to stay alert, do your homework, and prepare for change.
Could we be on the brink of the next big rally? Given the data, it’s tempting to say yes. But as always, the market doesn’t owe us certainty. The only thing history shows is that extremes—whether fear or complacency—often don’t last.
Frequently Asked Questions (FAQs)
Q: What exactly is India VIX?
A: India VIX is a measure of expected market volatility over the next 30 days based on Nifty options prices. A higher VIX suggests market uncertainty; a lower VIX indicates calm.
Q: How often does India VIX fall below 11?
A: It’s quite rare. In the last decade, it has happened only five times.
Q: Does a low India VIX guarantee a market rally?
A: No indicator is foolproof. But historically, 4 out of 5 times when India VIX dipped below 11, the Nifty index saw 20%+ gains over the next 6–12 months.
Q: Why was the COVID period an exception?
A: The dip below 11 in December 2019 was followed by a global crisis triggered by the pandemic, making it a unique outlier in the data.
Q: Should I invest now based solely on India VIX?
A: Treat it as a helpful signal, not financial advice. Consider your investment goals, risk appetite, and consult trusted resources before making decisions.
References
- India VIX Historical Data : Access detailed daily data for India VIX, including open, high, low, and close prices, at Yahoo Finance.
- India VIX and Nifty 50 Returns Analysis : Explore insights into the relationship between India VIX levels and Nifty 50 returns at Investing.com.
- Understanding India VIX : For a comprehensive explanation of what India VIX is and its significance, refer to The Economic Times.
- Nifty 50 Returns Data : Review historical annual returns of the Nifty 50 index at PrimeInvestor.
- India VIX Seasonal Trends : Analyze seasonal patterns and trends in India VIX at Moneycontrol.
- India VIX Calculation and Importance : Learn about the calculation methodology and importance of India VIX at Groww.
- India VIX and Market Volatility : Understand the role of India VIX in forecasting market fluctuations at Tradejini.
More from Investing
Beyond Returns: Why I Built a More Intelligent Midcap Mutual Fund Screener
Looking for the best midcap mutual funds in India? This article explains how our Midcap Mutual Fund Screener goes beyond traditional return-based...
How to Build a robust Passive Index Investing System that works
Passive investing has transformed the way investors build wealth. But with so many choices—from Nifty 50 Index Funds and Nifty Next 50...
A Simple, Peaceful ETF Rotation Strategy That Delivered 32% CAGR
Markets are constantly shifting leadership between sectors, asset classes, and global markets. Instead of trying to predict where the next opportunity might...